Trends in Legal Alcohol Limits and Drunk Driving Statistics

Drunk driving remains a significant cause of traffic fatalities, as alcohol significantly affects a driver’s ability to make quick decisions and react on time. In the United States, approximately 37 people die every day due to alcohol-impaired driving—roughly one life lost every 39 minutes, according to NHTSA report. This results in over 11,000 deaths annually, which is why driving under the influence is prohibited across all 50 states, Washington, D.C., and Puerto Rico.
This blog will examine drunk driving statistics, highlighting which states see the highest rates of alcohol-related incidents and the broader economic and social impacts of these tragedies. By comparing past and present data, we aim to shed light on ongoing challenges and progress in combating drunk driving. Let’s explore this important topic together.
Drinking and Driving Facts
- According to Alcohol.org, a driver is legally considered impaired when their blood alcohol concentration (BAC) reaches 0.08 or higher.
- In the U.S., an alcohol-related fatality occurs every 39 minutes, according to the National Highway Traffic Safety Administration (NHTSA).
- Drunk driving crashes account for 11,000 deaths annually, making up about one-third of all traffic fatalities, as reported by the NHTSA.
- The economic toll of drinking and driving exceeds $58 billion each year, covering both fatalities and property damage.
- The penalties for driving under the influence are severe. A first DUI offense can result in fines and legal fees totaling $10,000 or more.
- Statistically, drunk driving accidents are most common during the summer, particularly in July, according to the National Safety Council.
Alcohol-Related Traffic Deaths Across the U.S.
The National Highway Traffic Safety Administration (NHTSA) tracks drunk driving incidents in the U.S., but the data is not always easy to understand. For example, in the 2019 report, Table 3 compares data from 2019 to 2010, while in the 2022 report, it compares 2022 data to 2021. To get more accurate information, we carefully reviewed the reports.
Let’s start by looking at the number of alcohol-related fatal accidents and what percentage they represent of all traffic deaths each year.
Table 1: Alcohol-Related Fatal Accidents and Their Share of All Traffic Fatalities by Year
From the reports, we found that drunk driving accidents are more likely to happen at night than during the day, which makes sense because more people drink in the evening. In 2022, there were over three times as many alcohol-related fatalities at night as during the day.
If you ever face personal injury loss because of someone else's mistake, hiring a car accident attorney can help you get the compensation you deserve.
Table 2: Comparison of Daytime vs. Nighttime Drunk Driving Fatalities
The data shows that there were more sober driver fatalities during the day than at night, likely because there is more traffic during the day. Still, the number of nighttime drunk driving fatalities is much higher.
We also looked at other people affected by drunk driving, such as passengers, people in other vehicles, and non-vehicular road users like pedestrians and cyclists. Here's a breakdown of who was affected and the percentage of deaths they represent.
Table 3: Breakdown of Drunk Driving Fatalities by Role and Percentage
As shown in the table, most of the drunk driving fatalities involve the alcohol-impaired drivers themselves. However, innocent people, including passengers, other vehicle occupants, and non-vehicular road users, are also victims. Together, they make up 28% of the deaths caused by drunk driving.
Drunk Driving Statistics 2024
Based on NHTSA data, drunk driving patterns differ widely by age, gender, and location. Younger drivers, motorcyclists, and people with past DUI convictions are most likely to drive under the influence.
Age
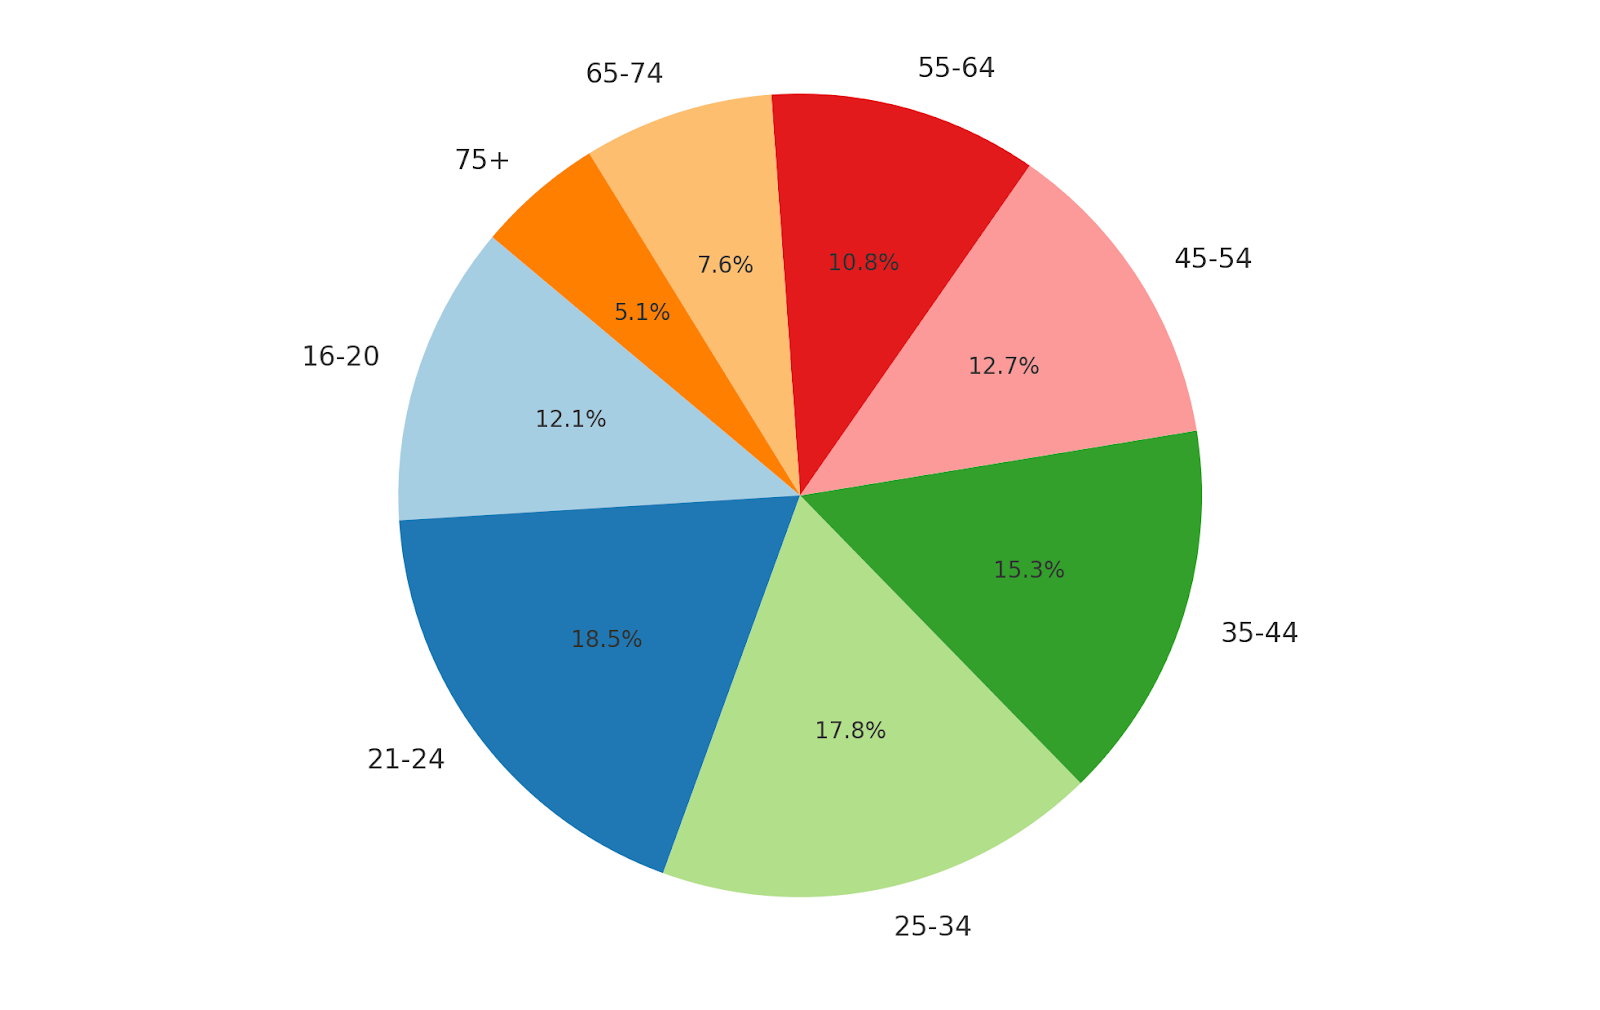
Young adults face the highest risk of drunk driving. According to NHTSA, drivers aged 21-24 make up 29% of all fatal alcohol-related crashes, with those aged 25-34 close behind at 28%. Minimum drinking age laws have saved over 30,000 lives.

Note: This pie chart shows the 2024 percentages of alcohol-impaired drivers in fatal crashes by age group, with young adults, primarily ages 21-24 and 25-34, as the most affected.
Gender
Data also shows that men are more likely than women to drive under the influence. FBI drunk Driving Statistics from 2019 indicate that men made up about 74% of drunk driving arrests.
States with the Highest Rates of Drunk Driving
A Forbes Advisor analysis found that Montana has the highest rate of drunk driving incidents while New Jersey has the lowest rate. Four of the top 10 worst states for drunk driving are in the West: Montana, Wyoming, Oregon, and New Mexico. Meanwhile, 6 of the 10 states with the lowest drunk driving rates are in the Northeast, including New Jersey, Delaware, Massachusetts, New York, Pennsylvania, and Vermont. Additionally, a survey of 10,000 licensed drivers showed that over 42% had seen a friend or family member drive after having more than one drink.
Note: This bar graph displays the "Total Score Out of 100" for drunk driving incidents by state, ranked in ascending order for easy comparison across states.
Car Insurance and DUI Rates
According to Quadrant Information Services, car insurance costs can increase significantly after a DUI. On average, a DUI conviction raises car insurance rates by about 71% based on rates from major insurance companies.
Insurance companies usually review your driving record when you apply for or renew a policy. They adjust rates based on tickets, convictions, and other factors.
Table:
Note: This table shows that a DUI and poor credit can lead to the highest rate increases, with poor credit adding up to 90% more on average.
How is the rate of drinking and driving changing?
Despite the ongoing efforts of groups like Mothers Against Drunk Driving (MADD) and public agencies like the NHTSA and CDC, the number of drunk driving incidents is slowly rising after years of decreasing.
The lowest number of drunk driving deaths occurred in 2011 and 2014, but since 2019, these deaths have been increasing across the country. Experts think the rate of drunk driving may be stabilizing after the high levels seen during the pandemic, with about 20 states reporting fewer fatal accidents in 2022.
Considering these factors, lawmakers and the NHTSA encourage car companies to add technology to prevent drunk and impaired driving in new vehicles. MADD is also calling for stronger public awareness campaigns.
Looking at the history:
- Drunk driving deaths have dropped from 41% of all crash deaths in 1985 to 31% in 2021.
- The NHTSA reports that deaths caused by alcohol-impaired driving dropped by 53% from 1982 to 2011.
- The overall drunk driving death rate fell from 2016 to 2019 but started increasing again in 2020.
The Foundation for Advancing Alcohol Responsibility says, "Since 1982, drunk driving deaths have gone down 36%, while overall traffic deaths have decreased by 3%." However, the group also states, "There is still more work to be done, and our commitment to ending drunk driving is stronger than ever."
Top 5 Strategies for Drunk Driving Prevention
Here are five efforts to stop drunk driving:
- Sobriety checkpoints set up by police officers help reduce deaths, injuries, and accidents caused by drunk driving.
- On the Saturday before Labor Day, Mothers Against Drunk Driving (MADD) works with police officers to organize media events and raise awareness.
- The "Drive Sober or Get Pulled Over" campaign by NHTSA runs from December 13 to January 1 and teaches drivers about the dangers of drunk driving.
- In states where first-time drunk drivers are required to use ignition interlocks, the number of drunk driving deaths has gone down. Drivers must blow into a device about the size of a cellphone to start their car. If their blood alcohol content is too high, the car won’t start.
- High-visibility saturation patrols involve many police officers patrolling areas where drunk driving accidents are expected to catch offenders.
Let’s Recap
Drunk driving continues to be a severe problem, causing thousands of deaths and high economic costs each year. While efforts to reduce these incidents have led to some progress, the number of alcohol-related fatalities has started to rise again.
If you face false drunk driving charges, it’s important to have experienced legal help. Visit LawyersRating.fyi, connect with top attorneys who can provide expert guidance and help you navigate the legal process confidently, ensuring you receive the justice you deserve.


