2024 Immigration Trends: What the Data Says About U.S. Immigration


In 2024, the global immigration landscape will be shaped by factors such as rising immigration fees, budget adjustments, team size shifts, and unpredictable policy updates. These shifts are prompting employers to rethink and adjust their approaches to stay ahead. This year’s report dives into the current business climate and predicts what lies ahead.
The United States remains the top destination for immigrants, hosting one-fifth of the world’s international migrants from nearly every country. In this blog, we uncover what the 2024 data reveals about U.S. immigration trends and how U.S. Citizenship and Immigration Services plays a key role in shaping these movements.
What Percentage of the U.S. Population Are Immigrants?
According to the United States Census Bureau, the U.S. foreign-born population reached a historic 47.8 million in 2023, marking an increase of 1.6 million compared to 2022. This represents the most significant annual growth over two decades, reflecting a trend that began after Congress reformed U.S. immigration laws in 1965. In 1970, the immigrant population was only about one-fifth of what it is today, highlighting the significant acceleration in migration over the years.
Today, immigrants comprise 14.3% of the total U.S. population, a notable rise from 4.7% in 1970. While this is the highest percentage since 1910, it still falls short of the 14.8% recorded in 1890. These shifts underscore the critical role of immigration and the policies managed by U.S. Citizenship and Immigration Services in shaping the nation's demographic landscape.

Note: Here is a pie chart representing the composition of the U.S. population in 2023. It shows that 14.3% of the population is foreign-born, while 85.7% is U.S.-born.
What are the origins of U.S. immigrants?
According to U.S. Citizenship and Immigration Services, immigrants in the United States come from diverse regions worldwide. Mexico is the top-notch country of birth for U.S. immigrants, with 10.6 million individuals in 2022, making up 23% of all immigrants.
Other significant countries of origin include:
- India: 6% of immigrants
- China: 5% of immigrants
- Philippines: 4% of immigrants
- El Salvador: 3% of immigrants
By region of birth:
- Asia: 28% of all U.S. immigrants
- Latin America (excluding Mexico): 27%
- Caribbean: 10%
- Central America: 9%
- South America: 9%
- Europe, Canada, and North America: 12%
- Sub-Saharan Africa: 5%
- Middle East and North Africa: 4%
This diverse composition highlights the role of U.S. Citizenship and Immigration Services in supporting and managing immigration from around the globe.
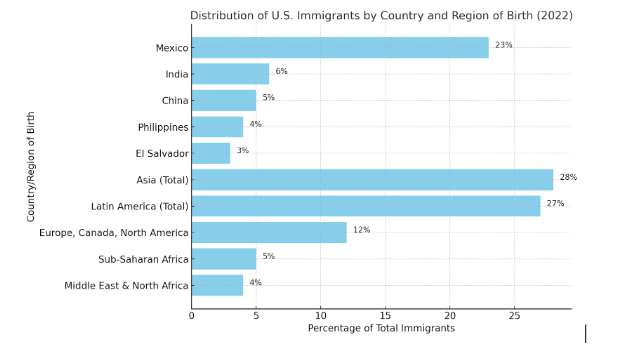
Note: Here is a bar graph illustrating the distribution of U.S. immigrants by country and region of birth in 2022. It highlights Mexico, India, China, other key origins, and regional contributions like Asia and Latin America.
How did the origin countries of immigrants to the U.S. Evolve in recent decades?
According to U.S. immigration law reports, the origin of immigrants to the United States has shifted significantly over the past decades, reflecting changes in immigration laws and global migration trends. Before 1965, U.S. immigration law, under policies that favored Northern and Western Europe, primarily excluded immigrants from Asia. The introduction of the 1965 Immigration and Nationality Act marked a turning point by opening pathways for immigrants from Asia and Latin America. Additionally, the Immigration Act of 1990 expanded legal immigration, welcoming people from a broader range of countries.
- Historically, immigration patterns were concentrated in Europe. Between 1840 and 1889, approximately 90% of immigrants to the U.S. came from Europe, with Germany, Ireland, and the United Kingdom accounting for about 70%. This trend continued from 1890 to 1919, with nearly 90% of immigrants originating from Europe, mainly Italy, Austria-Hungary, and Russia-Poland.
- Since 1965, these trends have diversified. Approximately half of all U.S. immigrants come from Latin America, with a quarter from Mexico alone. Similarly, a quarter of the immigrant population originates from Asia, including countries such as China, India, the Philippines, Central America, and the Caribbean.
- According to the MPI report, this shift has also transformed the immigrant populations in individual states. For instance, in 1980, German immigrants were the largest group in 19 states, Canadians led in 11 states, and Mexicans in 10. By 2000, Mexicans became the largest immigrant group in 31 states.
If you're experiencing difficulties or looking for the best immigration lawyer in the U.S., visit LawyersRating.fyi to find top-rated legal professionals.
An Overview of Immigrant Legal Status in the U.S
As of 2022, most immigrants in the U.S. are legally in the country, with 77% holding legal status. In fact, how many illegal immigrants are in the U.S.? According to the Department of Homeland Security (DHS) data, the breakdown of legal immigrant status is as follows:
- 4% are legal temporary residents
- 23% are unauthorized immigrants
- 49% are naturalized U.S. citizens
- 24% are lawful permanent residents
From 1990 to 2007, the number of unauthorized immigrants more than tripled, growing from 3.5 million to a peak of 12.2 million. Since then, the number gradually declined, reaching about 10.2 million in 2019. However, in 2022, the unauthorized immigrant population saw a resurgence, growing to 11 million for the first time since 2007.
These figures reflect the ongoing trends observed by U.S. Citizenship and Immigration Services, and estimates suggest continued growth in the unauthorized immigrant population for 2023 and 2024.
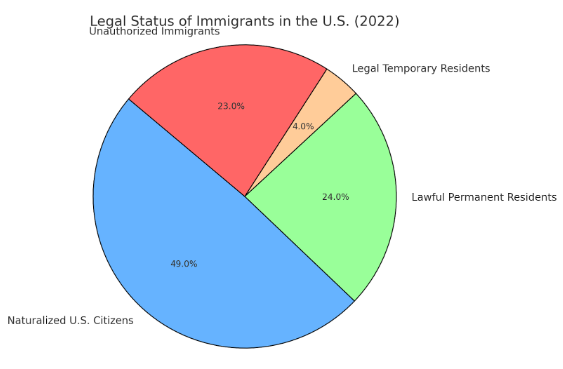
Note: This chart reflects the breakdown of the foreign-born population in the U.S., as reported by U.S. Citizenship and Immigration Services.
Who Falls Under the Category of Unauthorized Immigrants?
Unauthorized immigrants in the United States are individuals who entered the country without legal permission or overstayed their nonpermanent visas. However, many of these immigrants have obtained temporary legal protections that allow them to live and work in the U.S. and be temporarily shielded from deportation. As of 2022, about 3 million unauthorized immigrants were granted such protections. These immigrants fall into several categories:
- Temporary Protected Status (TPS): As of July 2022, about 650,000 immigrants held TPS, given to individuals who cannot safely return to their home countries due to civil unrest, violence, natural disasters, or other extraordinary conditions.
- Deferred Action for Childhood Arrivals (DACA): Nearly 600,000 immigrants benefit from the DACA program, which allows individuals brought to the U.S. as children before 2007 to remain in the country.
- Asylum Applicants: As of mid-2022, around 1.6 million immigrants had pending asylum applications. These immigrants can legally remain in the U.S. while awaiting a decision on their cases, often due to dangers in their home countries.
In addition, by the end of 2023, around 500,000 immigrants arrived in the U.S. under programs like Uniting for Ukraine (U4U) and CHNV parole, designed for individuals from Ukraine, Cuba, Haiti, Nicaragua, and Venezuela. These arrivals, who mostly came after 2022, may be included in future immigration estimates managed by U.S. Citizenship and Immigration Services.
Which States Are Home to Most U.S. Immigrants?
In 2022, the majority of the 46.1 million immigrants in the United States resided in just four states: California (10.4 million, or 23% of the total), Texas (5.2 million, or 11%), Florida (4.8 million, or 10%), and New York (4.5 million, or 10%).
Geographically, most immigrants lived in the South (35%) and West (33%), with the Northeast housing 21% and the Midwest home to 11% of the immigrant population.
More than 29 million people (63%) of the foreign-born population lived in 20 major metropolitan areas, with the largest concentrations in the New York, Los Angeles, and Miami metro areas. Notably, these urban regions also hosted the majority (60%) of the nation’s unauthorized immigrant population, a trend influenced by policies from U.S. Citizenship and Immigration Services.
Hire a Top-Notch Immigration Attorney Today!
Immigrants are a crucial part of the U.S. economy, contributing significantly to entrepreneurship, taxes, the workforce, and public services. Their efforts benefit local communities, support industries, and drive growth in many sectors. Immigrants are deeply woven into America's economic and cultural fabric, playing an important role in the nation's prosperity.
If you're facing challenges or searching for the best U.S. immigration lawyer, visit LawyersRating.fyi, where you can find highly-rated and reputable lawyers to assist you!